When I arrived on PROPHET certain decisions had already been
taken, including the tool set:
- Enterprise Architect
- Trac
- Java
- Maven
- JUnit
It has been part of my job, to glue these together for the
project manager and design authority. The purpose of this article is to
communicate the mechanisms used on PROPHET, with the aspiration that they can
be used on other projects.
The story of the metrics starts with the effort and
measurement of effort and then moves on to progress against required
functionality.
Effort Estimation
The first set of tickets that we were managing were design
tickets. We attempted to put estimates on these tickets and needed somewhere to
store the estimates. Keeping the estimation related to the work in the same
place as the ticket, so we searched for a Trac plugin that would allow us to put
estimates on the tickets. The Time and Estimation plugin, allows both the
effort estimate and the actual time spent to be recorded.
Collecting the Data
The data collected is only of use if it can assist decision
making and to do this it needs to be of sufficient quality. The time and
estimation plugin gives some reports to help enforce the collection of data,
such as a handy developer work summary report that allows team leaders to see
when developers last logged time in Trac.
Another choice that is important that the correct
measurements, for example the choice of effort which is a constant, rather than
an end date which can and will move, resulting in the ticket values having to
be rewritten for the new plan. This rewriting is of course a waste of effort if
the correct constant values can be chosen.
Once collected the data is extracted from Trac using a
custom report, and exported into a spread sheet. The spreadsheet gives a view
of the figures varying over time. This allows the comparison of the previous week’s
progress against the current weeks estimate.
Walking through the process from the start, a wiki page is
used to provide the parameters that are required to generate the report. The
wiki page allows an HTML form to be embedded in the page.
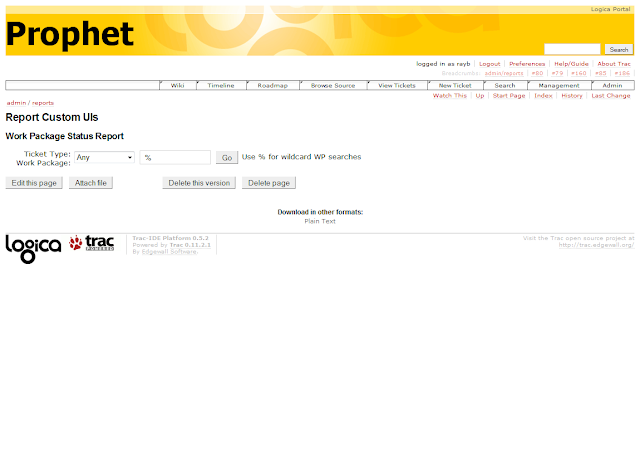 |
| wiki page to execute the custom report |
The result of the custom report is CSV, which can be
downloaded from Trac and loaded into Excel. The data can then be copied into a
spreadsheet which contains macros and the previous weeks data.
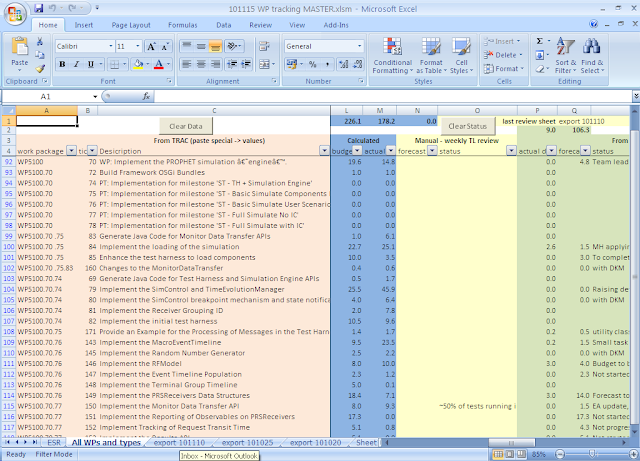 |
| custom report |
Interpreting the Information
Once a couple of milestones have been delivered you can
assess the trend of estimation. Are they always underestimates? This could
indicate that the team is not as experienced as the estimator expects or the
estimator has under estimated the complexity of the system. Is there a high
variability in the estimates? This could indicate that the grasp of the
requirements was weak when the estimate was made. The case of underestimation is
fairly easy to manage when you discover it, by applying a velocity multiplier
to the estimates. The case of a weak understanding of the requirements is more
difficult to fix once the ticket is under way and the plan made. Either way
having the figures gives you some evidence to back up your gut feeling, as to
how your project is going. Hopefully it will also give you confidence to take
action to fix any issues that have been identified.
Setting Expectations about End Dates
When dependencies have been identified and reliable
estimates a Gantt chart can be produced showing the estimated end date of the
project.
 |
| planning Gantt chart |
Measurement of Progress Against Functionality
After we moved from the design phase into the implementation
phase, we started to focus on the progress that we were making against the plan.
The first question that we asked was how we were going to track progress,
whether it was by class responsibilities, UI widgets or functional tests? Well
class responsibilities will vary depending upon the design, and interpretation
of the system. Likewise, UI widgets suffer the same issue.
Firstly, whatever metric is chosen it should be tied back to
the client expectations, as not delivering on their expectations is a fast way
of losing your client. As the clients expectations have been expressed by their
requirements, this is a good place to start. Secondly, the metric must be
measurable by the client, so must be related to a working system. The closest candidate
that I have seen is results of automated acceptance tests. To ensure that the
acceptance tests reflect the requirements, a requirements trace is performed.
Collecting the Data
Firstly we specified our convention for the test definition
in the ticket description, where we had a tests heading and an ordered list of
tests. This gave each test a unique identifier of the ticket number and test id.
A sub list spelt out what steps were required of the test, but was not strictly
required to perform the measurement of progress.
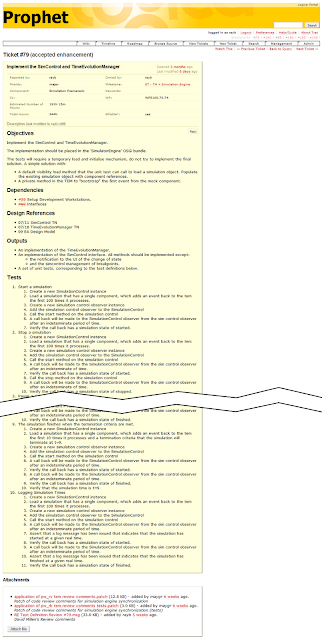 |
| Trac ticket description with tests |
Next we decided how to write our test implementation, using
JUnit. By tying the definition and implementation together using a convention
in the test method name we were able to extract the ticket and test definition
from the JUnit report results, allowing us to map the definition to the
implementation, to the test result. The final piece was to mark the
requirements with a ticket and test number in Enterprise Architect.
We had a couple of choices about how to mark our test
methods with the ticket and test number: Java annotations, Javadoc annotations,
or a method name convention. We actually implemented a Java annotation, and
started writing test methods before we had started automating the solution.
This caused a headache down the line as I was unable to get the combination of
the JDT compiler and Tycho to perform annotation processing. After working my
way round the problem, we switched to using a method name convention as it was guaranteed
to work. We had to update our methods, however all the important information
had already been captured, so the task was donkey work for half a day rather
than it resulting in missing tests. For this sort of thing it is better to take
a guess on the implementation and capture the information, than to delay the
process and lose the information.
Whenever you are setting expectations, it is important to
have a plan of progress and the measurement of actual progress so they can be
compared to check that you will deliver on the expectations you have set. By
making an estimate of the test definitions from the available effort and
inserting identifiable placeholders into the tests we were able to defer
writing the actual tests until after the process had started to be used and
proved to work. The placeholder tests were identified as only having a summary
of a single letter of the alphabet, allowing the progress of writing test
definitions to be tracked. This gave the Project Manager an idea of what the
likely final figure for the tests would be, so he could set expectations with
the client and management. The placeholder identification statistics allowed
him to spot a likely bottleneck in the process.
Automating the Report Generation
We now had a good idea of how the process was going to work,
started capturing data, and set about automating the process. I wrote a maven
plugin that grabbed the test definitions and blended them together with the
test results to provide a tracing report containing:
- ticket
- test definition
- class name
- method name
- test result (could be pass, fail, skipped)
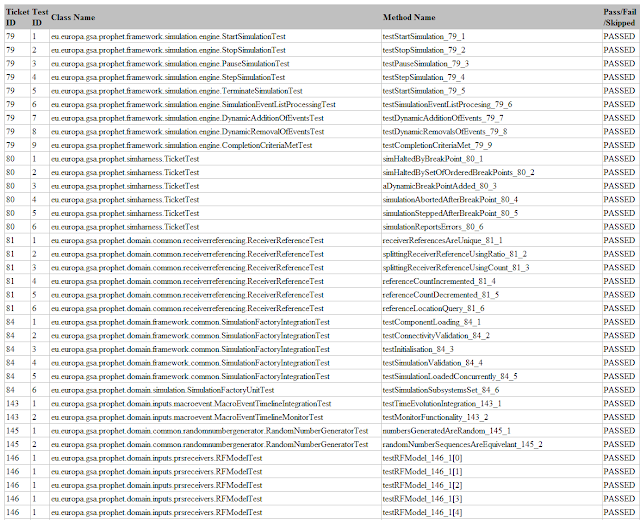 |
| tracing report |
The test definitions were grabbed from Trac by reading an
RSS feed from a custom query. By altering the query we were able to produce reports
for individual teams, or any other criteria that the PM was interested in.
The output of the plugin was an HTML file, which could be
imported into excel. A similar export was taken from EA, matching up the ticket
and test number to give a final spreadsheet that could be incorporated into our
deliverables.
The same code was used to count the tests written, the
estimated progress, the tests implemented, and the tests passing which was the
actual progress. These statistics were supplied to Logica management by the Project
Management to demonstrate progress.
 |
| statistics report |
The final part of the progress reporting was to build a
summarised view of the test definitions which counted the number of tests on
each ticket. The PM could then use this, along with the ticket completion dates
from the Gantt chart to work out how many tests should be complete on a given
date. This was plotted as a chart of planned progress, to which was added a
line of tests passing on a give date, the actual progress.
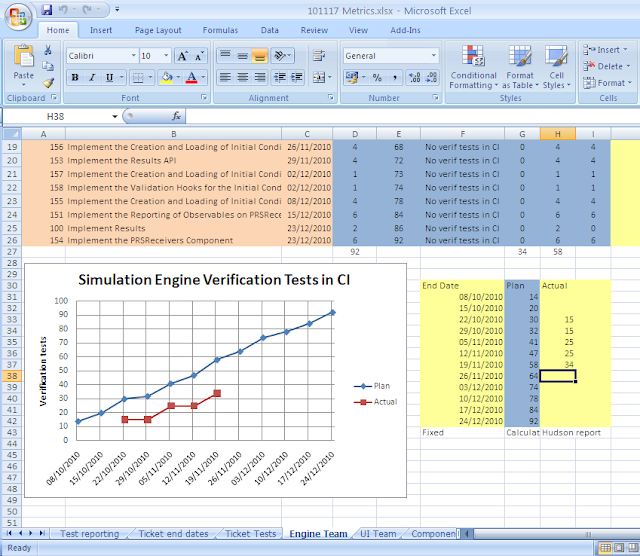 |
| progress chart |
The entirety of this process, took a few weeks to implement
when interspersed with other work. All the reports have been exposed via a
browser interface for easy access by the Project manager and Team Leaders,
which we have done by using Hudson functionality to publish artifacts.
An important point to note is that the test results in the
Hudson screen shot show both tests that implement test definitions and any
other JUnit tests.
Summary
We have removed a very labour intensive and error prone part
of the project by automating the reporting. This should lead to a better
product as we are able to see where the holes are and take action before the
client has a chance to see the product. By giving ourselves this foresight we
should be able to deliver to our promises and reassure the client that we are
going to deliver to their expectations.
The Future
Future work revolves around the review process, speeding it
up and making the process easier for the reviewer. These are things such as
ensuring that the review process has been finished, and providing a way of
comparing the test definition to the test implementation.
Speeding up the process will reduce rework and improve
quality by closing the time between developers making non-optimal decisions and
the review catching these.
Finally it will help planning by detecting bottlenecks in
the delivery of tickets at the review stage.
Other work includes the improvement in identifying
dependencies and the effect of dependencies, such as whether they are end to
start dependencies or not. This extra information is stored as text, in a bulleted
list of dependencies. The dependencies can then be used by the Project Manager
to construct the Gantt.
How Applicable is this to Other Projects
Integrating this with your issue management system may be somewhat different, however the only real integration point is the RSS feed that supplies ticket information and the custom queries. Happy metrics!


No comments:
Post a Comment